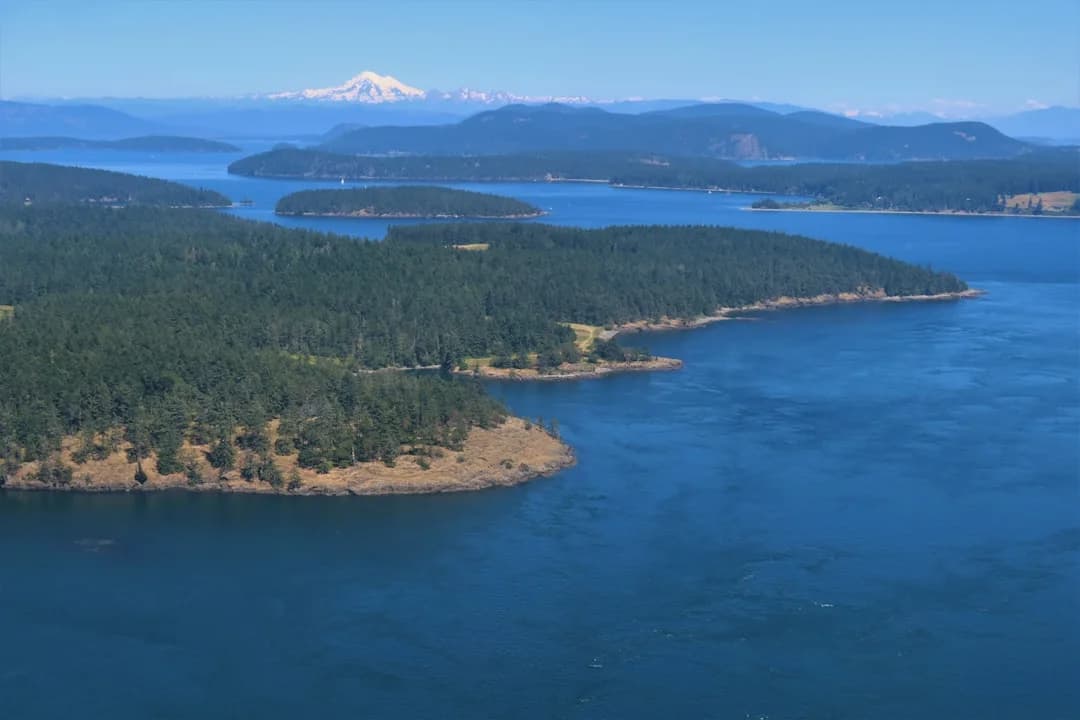
How to Read Nautical Charts: A Sailor's Guide
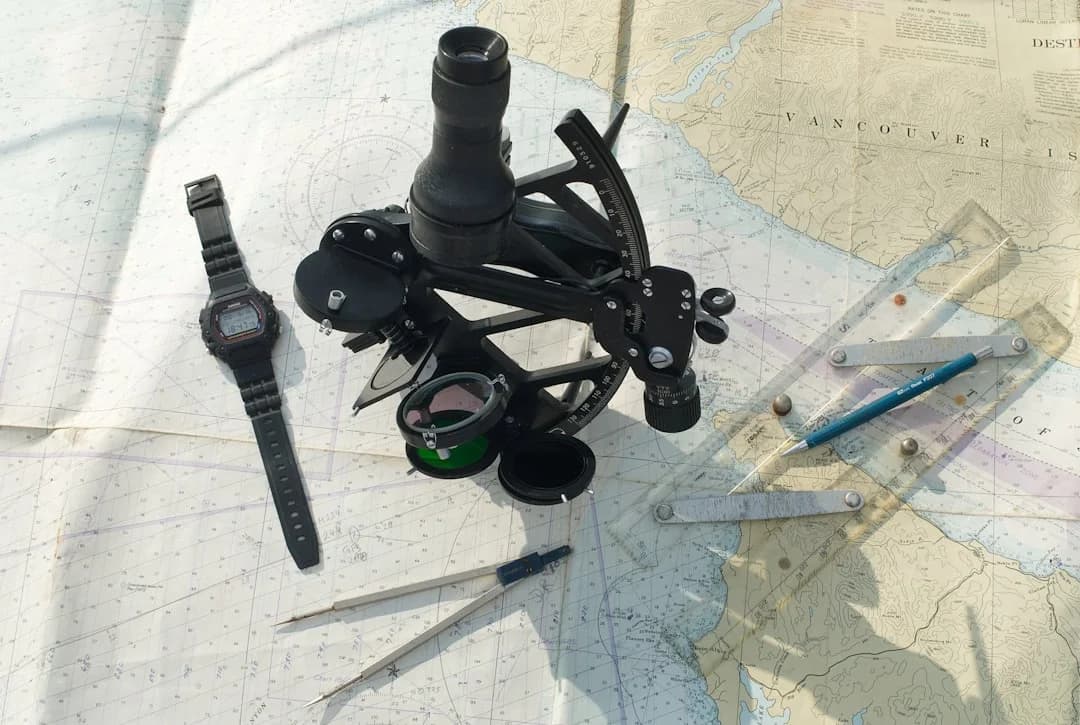
A nautical chart is not a map. Maps show you where things are. Charts tell you where not to go — and that distinction matters when you're drawing 5 feet of water over a rocky shelf that's 4 feet deep at low tide. Every year, boats run aground because their skippers treated the chart like Google Maps instead of reading what it actually says.
Modern chartplotters make navigation seem effortless, but the electronic display is only as good as your ability to interpret what it shows. Understanding chart symbols, depth contours, navigational aids, and tidal information is a fundamental sailing skill — and one that too many GPS-dependent sailors skip.
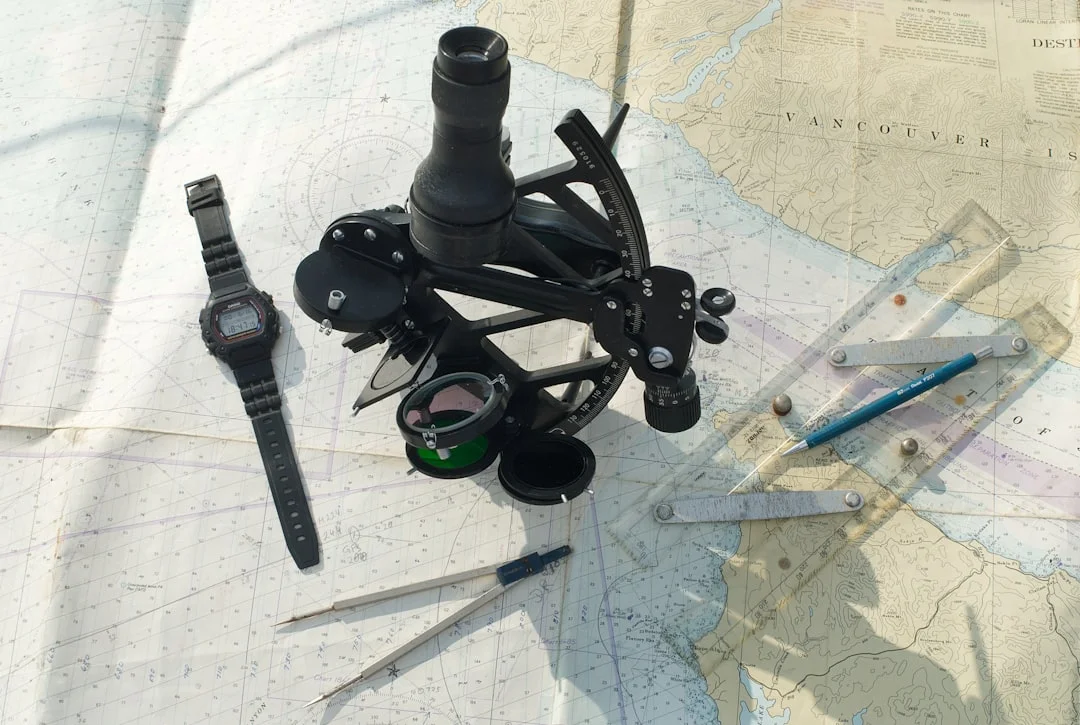
Photo by Stephan Hinni on Unsplash
Chart Basics: What You're Looking At
Depth Soundings
The numbers scattered across the water area on a chart are depth soundings — measured in meters, feet, or fathoms (1 fathom = 6 feet) depending on the chart. Always check the chart's title block for the depth unit — mixing up meters and fathoms is a fast way to run aground.
| Unit | Symbol | Where Used |
|---|---|---|
| Meters | m | Most international charts (UKHO, French, Greek) |
| Feet | ft | US charts (NOAA) |
| Fathoms | fm | Older charts, some US offshore |
Critical: depths on charts are measured from chart datum — typically the Lowest Astronomical Tide (LAT) or Mean Lower Low Water (MLLW). This means in normal conditions, the actual water depth is greater than or equal to the charted depth. At extreme low tides, it can briefly be less. Always add current tide height to the charted depth for the real number.
Depth Contours and Colors
Charts use color shading and contour lines to show depth zones:
| Color/Shading | Meaning |
|---|---|
| Green/dark | Drying areas — exposed at low tide |
| Blue (light) | Shallow water — typically 0–5m |
| White | Deep enough for most vessels — 5m+ |
| Contour lines | Connect points of equal depth (like topographic lines on land maps) |
The 5-meter contour is the most important line on a chart for most cruising sailors. Stay outside it and you won't ground a typical sailboat. Catamarans with 4-foot draft have more freedom; deep-keeled monohulls drawing 7 feet need to respect the 2-meter (6.6 ft) contour as their danger line.
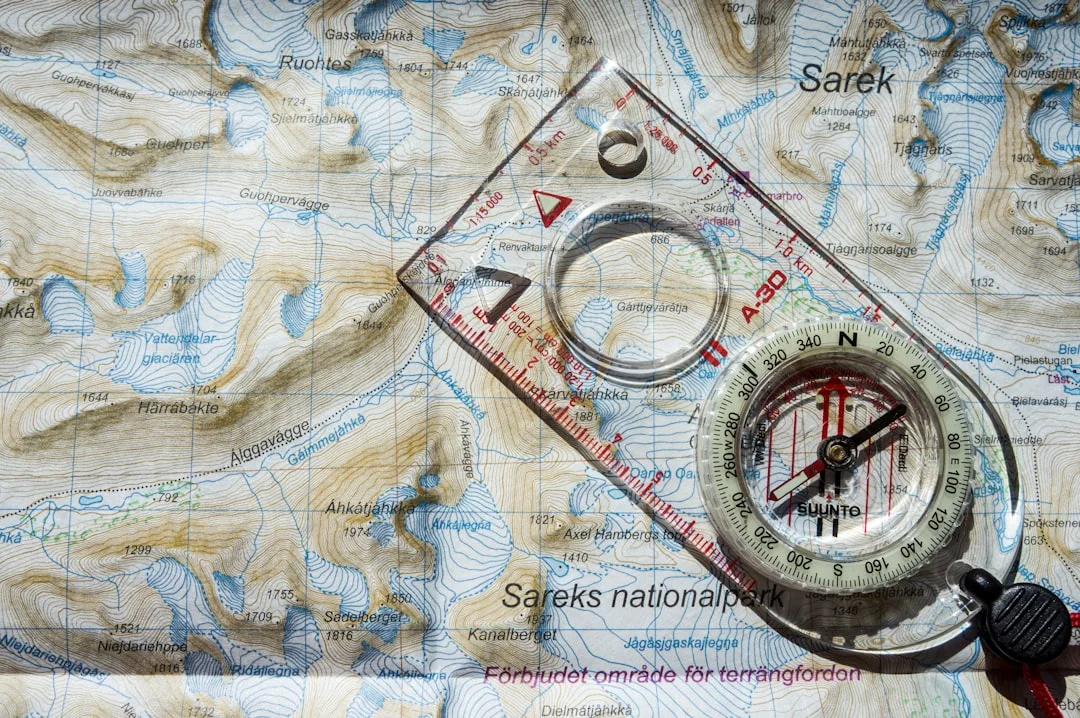
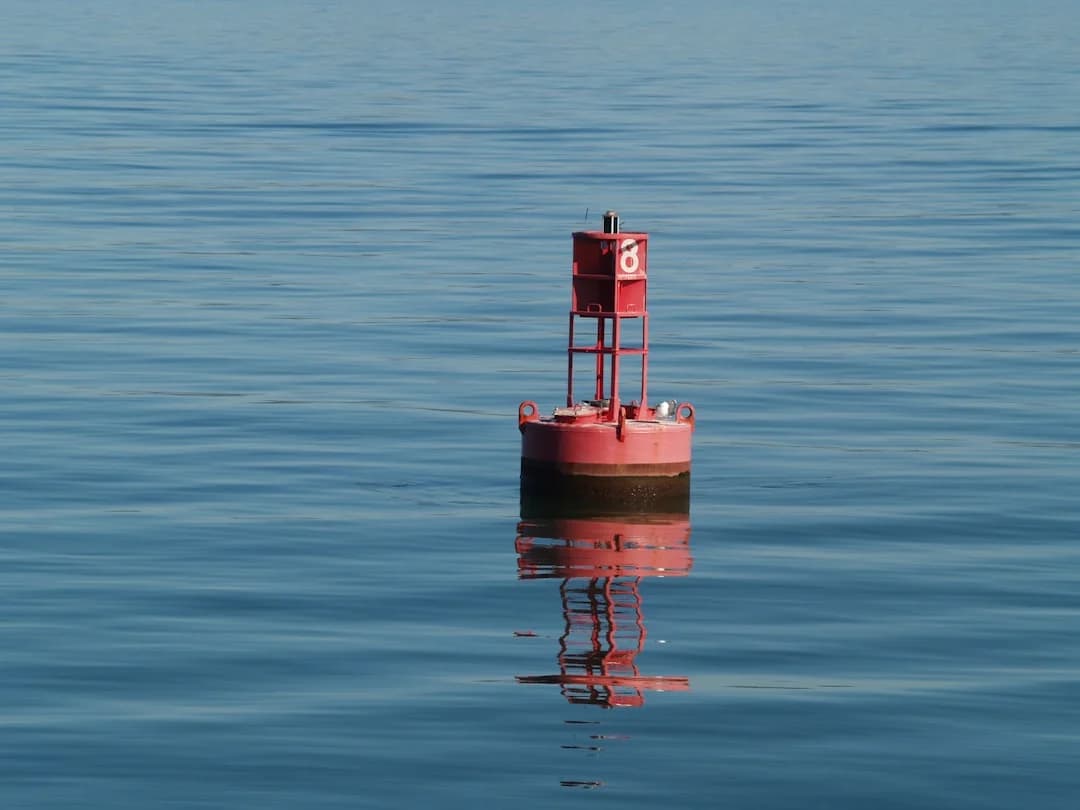
Photo by Hendrik Morkel on Unsplash
Chart Symbols Every Sailor Must Know
Navigation Aids (Buoys and Marks)
The IALA buoyage system uses two regions: A (Europe, Asia, Africa, Australia) and B (Americas, Japan, Korea). The colors are reversed between regions.
IALA Region A (Europe): Red = port (left) when entering harbor, Green = starboard (right). Memory: "Is there any red port left?"
IALA Region B (Americas): Red = starboard (right) when entering harbor, Green = port (left). Memory: "Red Right Returning"
Cardinal Marks
Cardinal marks indicate which side of the mark has safe water, based on compass direction:
| Mark | Pass To The | Top Mark Shape | Light Pattern |
|---|---|---|---|
| North | North of mark | Two cones up | Continuous flashing |
| South | South of mark | Two cones down | 6 flashes + long flash |
| East | East of mark | Two cones base-to-base | 3 flashes |
| West | West of mark | Two cones point-to-point | 9 flashes |
Hazard Symbols
| Symbol | Meaning | Action |
|---|---|---|
| + (cross) | Isolated rock, awash at chart datum | Avoid at all tides |
| ***** (asterisk) | Rock that covers and uncovers | Dangerous at low tide |
| Dotted area | Foul ground (old anchors, cables, rocks) | Don't anchor here |
| Wk | Wreck — may be dangerous | Give wide berth |
| Dashed line | Submarine cable | Don't anchor |
| Anchor symbol | Recommended anchorage | Good holding, suitable depth |
Electronic Charts vs Paper Charts
Modern cruisers use Navionics, C-MAP, or OpenCPN on a chartplotter or tablet. The GPS position overlaid on the chart feels reassuring — but your GPS is accurate to 3 meters while the chart data underneath might be from a 1960s survey. Uncharted rocks exist between survey points. Never assume the electronic chart shows everything.
If you're planning routes between islands, use Breezada's sea distance calculator for accurate passage distances, then cross-reference with detailed charts for hazards along the route.
Paper charts don't need batteries, don't fail in rain, and force you to actually engage with the information. Carry them as backup even with full electronic systems. Recommended: Imray for the Med, NOAA for US waters (free PDF downloads), Explorer Chartbook for the Bahamas.
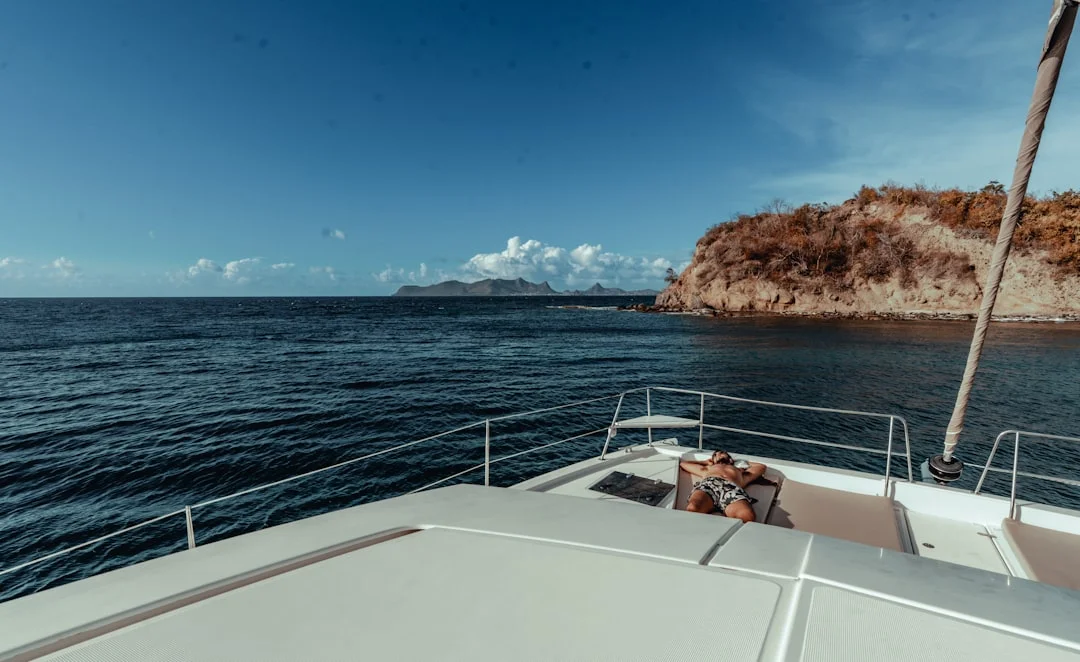
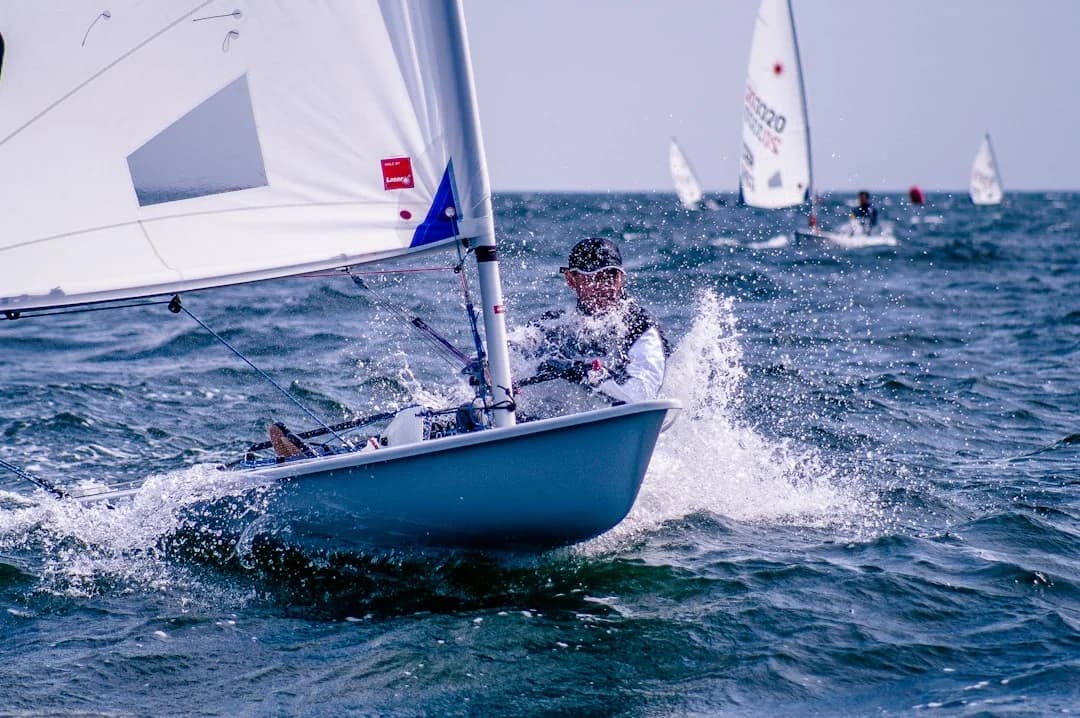
Photo by Hugh Whyte on Unsplash
Reading a Chart: Step by Step
When entering an unfamiliar harbor:
- Check depth: shallowest point on approach + current tide = actual water. Is there enough for your draft + 1m margin?
- Identify the channel: follow the buoys (red/green). Are they lateral (channel) or cardinal (hazard)?
- Find hazards: rocks, wrecks, shoals, cables within 200m of your track
- Note bottom type: S (sand), M (mud), R (rock), G (gravel), Wd (weed). Sand and mud = good anchoring; rock and weed = bad. For how bottom type maps to anchor choice and holding power, see our guide to the best anchor for a sailboat
- Check restrictions: no-anchor zones, speed limits, traffic separation schemes
- Plan your anchorage: anchor symbol or 3–8m depth, sand bottom, sheltered from expected wind
If you're new to navigation, our beginner sailing guide covers the fundamentals before chart reading.
Tidal Information on Charts
Actual depth = Charted depth + Tide height (from tide table)
Example: charted depth 2.5m, current tide 1.8m above datum = 4.3m actual. Safe for a 2m draft boat. But at low water springs (tide 0.2m), actual depth is 2.7m — much less margin.
Charts show tidal stream information using tidal diamonds (lettered diamonds with corresponding tables) showing current direction and speed at each hour relative to high water. In strong tidal areas (English Channel, Brittany), currents run 3–5 knots — ignoring them adds hours to your passage or sweeps you onto hazards.
Common Chart-Reading Mistakes
- Trusting the GPS dot — position accurate, chart data may not be. Poorly surveyed areas can be 100+ meters off
- Ignoring tide — 3m charted doesn't mean 3m right now
- Not checking survey date — some chart data is from 1870
- Confusing depth units — 3 fathoms = 5.5m, not 3m
- Zooming in too far on electronic charts — plotter interpolates between data points, creating false detail
Frequently Asked Questions
Do I need paper charts if I have a chartplotter?
For coastal sailing with a reliable chartplotter and backup tablet — probably not, but carry paper charts as emergency backup. For offshore passages, yes. At minimum, carry a large-scale overview chart of your cruising area.
Which electronic chart app is best?
Navionics has the most detailed worldwide coverage and best community depth data. OpenCPN is free and excellent for PC navigation. iSailor uses official UKHO data. For the Bahamas, Explorer Charts is the gold standard.
How often are charts updated?
Electronic charts update automatically (Navionics monthly). Paper charts via Notices to Mariners (weekly). The underlying survey data may be decades old — updates mainly cover new buoys, dredging changes, and new obstructions.
What's the minimum depth I need?
Your draft plus at least 0.5m safety margin (1m is better). Monohull drawing 2m needs 2.5–3m at low tide. Catamaran drawing 1.2m needs 1.7–2.2m. In coral areas, add extra margin — tropical cruising grounds like the Whitsundays often have isolated coral heads (bommies) inside otherwise sandy anchorages that don't show up on basic electronic charts.
About the Author
Related Articles
Sailing San Juan Islands: Routes, Tides & Moorings
Plan your sailing San Juan Islands trip with routes, tide tips, and moorings. Get the guide and chart your itinerary today.
By Breezada Team
How to Pick Up a Mooring Buoy: Med Mooring Tips
Learn how to pick up a mooring buoy with buoys & lazy lines, step-by-step. Get confident and dock faster—read the guide now.
By Breezada Team
Best Dinghy for Cruising Sailboat: Setup Guide
Learn the best dinghy setup for cruising sailboats—choose, equip, and stow it right. Read the guide and upgrade your tender today.
By Breezada Team
Sailing San Juan Islands Itinerary: 7 Days & Tides
Plan the perfect sailing San Juan Islands itinerary with a 7-day route, tide tips, and anchorages. Get the full day-by-day plan now.
By Breezada Team